


























NAIROBI, Kenya, May 29 – Kenya’s inflation accelerated to 6.7 percent in May 2026, driven by rising food, transport and energy costs, piling fresh pressure on households and complicating the Central Bank’s efforts to keep prices stable.
Latest data from the Kenya National Bureau of Statistics (KNBS) shows inflation rose from 5.6 percent recorded in April, marking a sharp increase in the cost of living amid higher fuel prices and sustained increases in essential consumer goods.
KNBS said the rise was largely driven by increases in the prices of food and non-alcoholic beverages, transport, and housing-related costs, which collectively account for more than half of household spending.
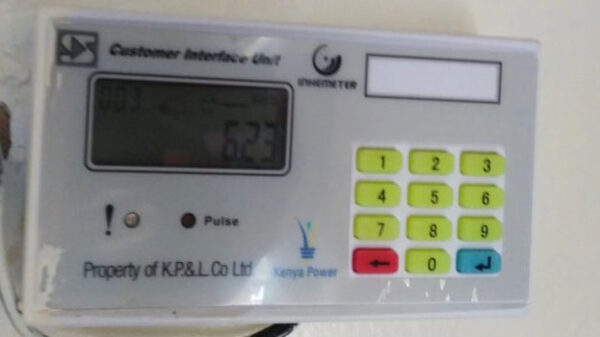
“Price increases were primarily driven by a rise in prices of items in the Food and Non-Alcoholic Beverages (9.4%); Transport (16.5%), and Housing, Water, Electricity, Gas and other fuels (3.4%) over the one-year period. These three divisions together account for over 57 per cent of the total weight across the 13 major expenditure categories,” KNBS said in its monthly Consumer Price Index report.
The statistics agency noted that the overall Consumer Price Index rose from 152.15 in April to 154.56 in May, translating to a monthly inflation rate of 1.6 percent.
“The Overall CPI and Inflation Trends between May 2025 – May 2026 indicates overall index increased from 152.15 in April 2026 to 154.56 in May 2026, resulting in a monthly inflation rate of 1.6 per cent. The year-on-year inflation stood at 6.7 per cent in May 2026.”
The latest inflation reading pushes Kenya further above the Central Bank of Kenya’s preferred target midpoint of 5 percent, raising concerns over consumer purchasing power and the broader cost of doing business.
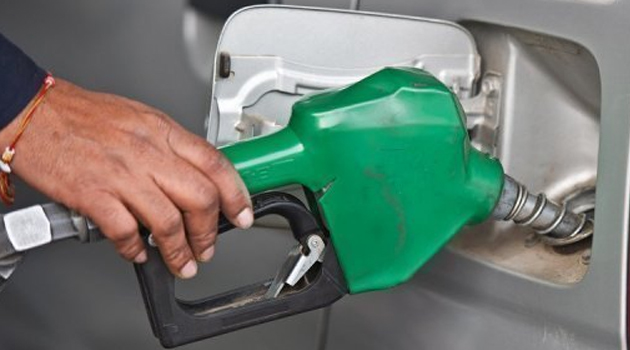
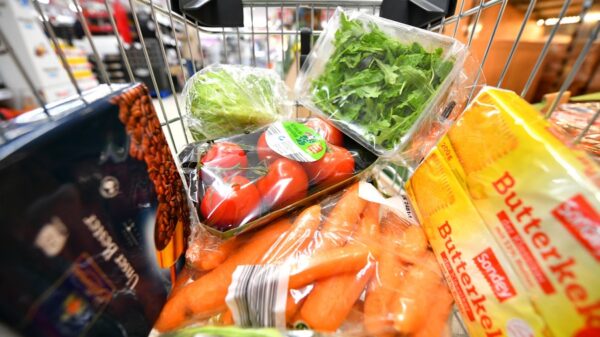
Food prices remained the biggest contributor to inflation, reflecting higher costs of basic commodities and supply chain pressures, while transport costs surged following elevated fuel prices that have continued to ripple across the economy.
Inflation is measured using the Consumer Price Index, which tracks changes in the prices paid by consumers for a fixed basket of goods and services relative to a base period of February 2019.
KNBS collects the data through monthly retail price surveys conducted across 50 urban data collection zones nationwide during the second and third weeks of every month.